FAQs
1. Basic Operations
Drag titles to the right-side panel, then click the "Start" button. Hold down the Ctrl or Shift keys to select multiple titles and perform batch operations.
Additionally, clicking on a title in the right-side panel will move it back to the left-side panel.
You can also drag the title from the right-side panel to the left-side panel.
2. Delete Data
SPSSAU is an online platform that automatically stores uploaded data and analysis results, and can be accessed anytime as long as there is internet connectivity. To delete data, go to "My Data" and delete it there. Analysis results can be deleted directly, and titles of uploaded data can be deleted via "Title Processing."
Note
The deletion process is irreversible; once data is deleted, it cannot be recovered, so please proceed with caution.
Account can be deactivated via "My Account," but this is also irreversible.
For more information on privacy policies, click to view.
3. Membership-Related Issues
A one-day membership restricts access to the Text Analysis and Power Analysis, and after purchase, upgrades or refunds are not supported. It is recommended to purchase a weekly membership directly, as the usage time will accumulate.
Once a membership is purchased, refunds are not available unless due to an issue with SPSSAU itself. For specific inquiries, please contact cs@spssau.com.
4. Unable to Use
SPSSAU supports a variety of browsers but does not support Internet Explorer or outdated browser versions. If you encounter issues such as not being able to drag items left or right, it is recommended to switch or upgrade your browser. If the problem persists, please contact cs@spssau.com.
5. Unable to Export Word or PDF Files
If you are unable to export to Word or PDF, it may be due to browser compatibility. It is recommended to switch to a different browser, with Google Chrome being the preferred option. Additionally, you may copy the tables in the results directly or download the results in Excel format.
6. Title Appears "Grey" and Cannot Be Dragged
If a title appears in "grey" and cannot be dragged, it is because "the title represents text, such as a fill-in-the-blank question, which cannot be analyzed." Please click to view the uploaded data page for further details.
7. Data Format Issues
Each research method requires a specific data format. Ensure your data is organized in the correct format before uploading it. For details on the required formats, please click to view.
8. Multiple Questionnaire Items Representing a Single Dimension
In some cases, several questions in a questionnaire may represent the same dimension.
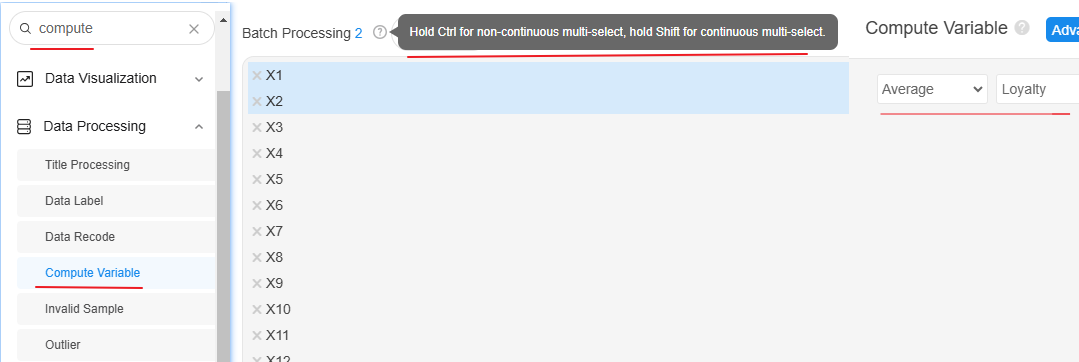
For example, consider two questions: X1: "I would recommend SPSSAU to my friends", X2: "I would use SPSSAU again if needed". These two questions reflect the dimension of "loyalty." If you need to treat "loyalty" as a whole rather than as separate titles, the handling method is as follows:

9. Data Recode
Data recode refers to replacing original data with new values. For example, if the age data (e.g., 13, 14, 23) needs to be grouped into three categories: under 20, 20-30, and over 30, this can be achieved through Data Processing-》Data Recode, as shown below:

| Item | Example |
|---|---|
| Numeric Coding | Changing the numbers 1/2/3/4/5 to 5/4/3/2/1 |
| Interval Coding | Grouping age data into 3 groups |
| Auto Grouping | Automatically grouping data into 2, 3, or 4 groups based on the median or 2 groups based on the mean |
10. Data Label
Data label refers to the meaning of numeric values. For example, if you have numeric values 1 and 2 in the results but want them displayed as "Male" and "Female," you can use Data Processing-》Data Label to achieve this, with batch processing available.
11. Analysis Sample Size Smaller Than Expected
Non-members can only analyze the first 100 samples, and many analysis items will exclude data with missing values (which will be automatically filtered out by the algorithm). It is recommended to use "Descriptive Statistics" to check for missing data or "View Data".
12. Inconsistent Analysis Results
If results do not match those from other software, please verify the following:
Ensure that you have a membership, as non-members are limited to the first 100 samples.
Ensure that your analysis data is exactly the same; compare the means in Descriptive Statistics to verify.
If the analysis involves maximum likelihood estimation (e.g., binary logistic regression, SEM, and other multivariate methods), discrepancies can occur under very low probability conditions, which is a normal result of mathematical principles.
When using bootstrap resampling (e.g., for mediation or moderation analysis), results may vary slightly, with differences like 0.00055 and 0.00054 being normal due to mathematical principles.
Randomness in algorithms, such as when performing K-means clustering, may result in inconsistent results across software. These differences are normal and stem from mathematical principles.
Other cases: For instance, when calculating decimal places, whether boundary values like 0 and 1 are included may lead to discrepancies. Such inconsistencies are possible across any software.
For specific algorithm details, consult the SPSSAU help manual.
If the problem persists, please send screenshots of your operations and data to cs@spssau.com.