SPSSAU Quick Start
1. Analysis Workflow
Analyzing data with SPSSAU is straightforward, following a three-step process of "drag, drop, and click":
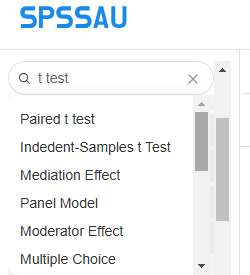
Search for or select your analysis method using the left "Dashboard";

Drag titles to the right-side panel, then click the "Start" button;
Note
Hold down the Ctrl or Shift keys to select multiple titles and perform batch operations.
Download results
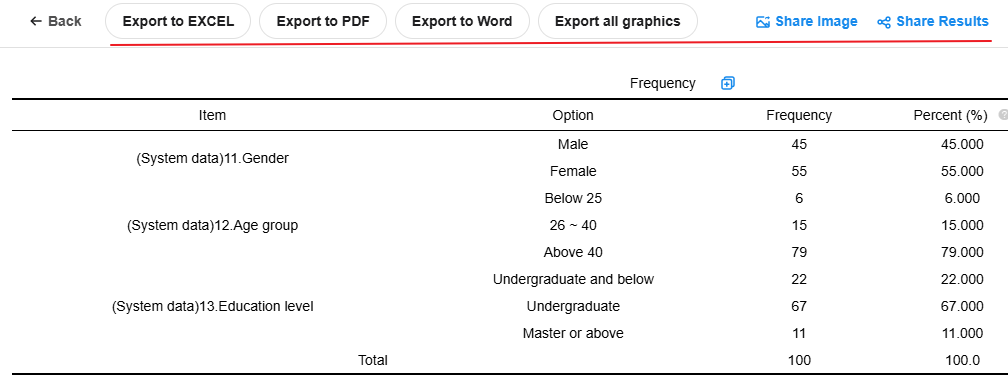
You can directly copy table results from the analysis page or download image results.
SPSSAU offers four types of result downloads: Excel, PDF, Word, and batch image downloads.

SPSSAU supports two forms of result sharing: sharing as images with a link, and sharing via a link that can be password-restricted.
2. Upload Data
For the "Text Analysis" module, you need to upload text data in Excel or TXT, with a file size limit of 5MB and a maximum of 50,000 rows.
Click for more information on data uploads.
3. Data Format for Analysis
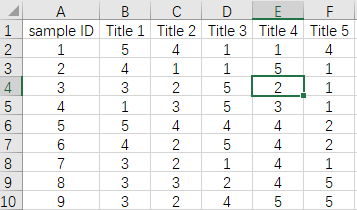
Data is typically organized with one column for each variable and one row for each sample, as illustrated below:

When using specific methods, it is essential to understand the corresponding data format requirements. For instance, an independent samples t test requires a column representing categories, with only two distinct values. Similarly, a linear regression involving five independent variables (X) and one dependent variable (Y) requires six columns of data.
Click for detailed data format requirements for each method.
4. Select Analysis Methods
If you're new to data analysis and unsure which method to select, start by identifying the data type, then match it to the corresponding method.
| Term | Description | Example |
|---|---|---|
| Quantitative | Numerical data with comparative meaning | Satisfaction with Google (Very Dissatisfied, Somewhat Dissatisfied, Neutral, Somewhat Satisfied, Very Satisfied) |
| Nominal | Numerical data representing categories | Gender (Male and Female), Field of Study (STEM and Humanities) |
- Quantitative:Numbers have comparative meaning, e.g., higher numbers represent higher satisfaction or greater height.
- Nominal:Numbers have no comparative meaning, e.g., gender, where 1 represents male and 2 represents female.
In SPSSAU, the right-side analysis panel shows the required data types for each method. For example, for an independent samples t test examining gender differences in satisfaction, the panel will display as follows:

Each method has specific data type requirements. Click to learn more details.
5. Membership Information
SPSSAU offers two types of membership: 1-day (24 hours from activation) and weekly.
The free version allows analysis of up to 100 samples (e.g., if you upload 10,000 rows, only the first 100 will be analyzed). It does not include customer support and restricts access to certain methods and modules. You will be notified of any restrictions during use.
The 1-Day Membership is suitable for quick data analysis, granting access to 11 modules, excluding "Text Analysis" and "Power Analysis".
The Weekly Membership enjoys exclusive membership benefits, including access to "Text Analysis" and "Power Analysis".
Payment Options: Currently, SPSSAU supports PayPal and Alipay.
Click to learn more details on membership benefits.
SPSSAU also offers occasional promotions, such as free trials and student discounts. Check the website for the latest offers.
6. Customer Support
If you run into any problems, members can access customer support. Click to submit your question.