Cluster Plot
Cluster Plot is a graphical tool used to visualize the comparative relationships between data. SPSSAU supports:
Batch analyze 'titles'.
Draw box plots with up to two grouping variables (e.g., gender, education).
Four types of summary values: mean, count, sum, and median.
Various display types, including Clustered Line Chart, Clustered Column Chart, and Clustered Bar Chart, all of which are provided by default in SPSSAU.

Note:
If you want to display the characteristics of two-category data, you can also use tools like 'Error Bar Plot' or 'Box Plot'.
Data Format

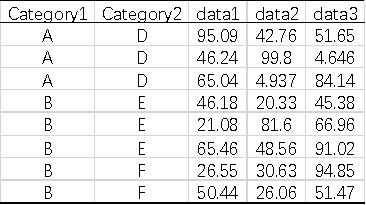
The data includes two Categories and the analysis data (Categories can be omitted during analysis).